
Archive for the ‘general math’ Category
I saw a great tweet from Marcus du Sautoy this morning who declared that today, June 28th, is a perfect day because both 6 and 28 are perfect numbers. This, combined with the fact that it is very sunny in Manchester right now put me in a great mood and I gave my colleauges a quick maths lesson to try and explain why I was so happy.
“It’s not a perfect year though is it?” declared one of my colleauges. Some people are never happy and she’s going to have to wait over 6000 years before her definition of a perfect day is fulfilled. The date of this truly perfect day? 28th June 8128.
Update: Someone just emailed me to say that 28th June is Tau Day too!
I do the administration for the Carnival of Mathematics and am very happy to announce that the 77th edition has been published over at Jost a Mon. If you are unsure what a Math carnival is then check out my introductory article or just read some past editions from either the Carnival of Math itself or its sister publication, Math Teachers at Play which is run by Denis of Let’s Play Math fame.
The next Carnival of Math is scheduled to be hosted over at JimWilder.com and the submission form for articles is open now. If you’d like to host a future carnival of math on your blog or website then please contact me for further details.
Last month I published an article that included an interactive mathematical demonstration powered by Wolfram’s new CDF (Computable Document Format) player. These demonstrations work on many modern web-browsers including Internet Explorer 8 and Firefox 3.6. So, how do you go about adding them to your own websites?
What you need
- Mathematica 8.0.1 or above to create demonstrations. Viewers of your demonstration only need the free CDF player for their platform.
- A modern browser such as Internet Explorer 8, Firefox 3.6 or Safari 5.
- Basic knowledge of HTML, uploading files to a webserver etc. If you maintain a blog or similar then you almost certainly know enough
Our aim is the following, very simple, interactive demonstration.
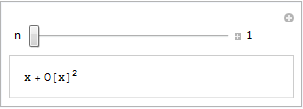
If all you see is a static image then you do not have the CDF player or Mathematica 8 correctly installed. Alternatively, you are using an unsupported platform such as Linux, iOS or Android.
Step 1 – Create the .cdf file
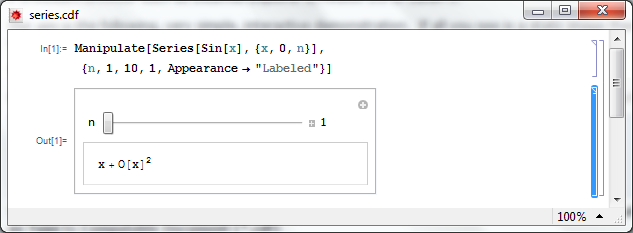
Fire up Mathematica, type in and evaluate the following code. You should get an applet similar to the one above.
Manipulate[
 Series[Sin[x], {x, 0, n}]
 , {n, 1, 10, 1, Appearance -> "Labeled"}
 ]
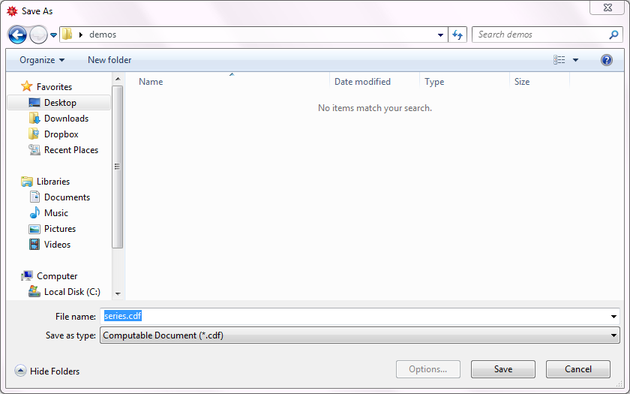
Save it as a .cdf file called series.cdf by clicking on File->Save as — Give it the File Name series.cdf and change the Save as Type to Computable Document (*.cdf)
Step 2 – Get a static screenshot
Not everyone is going to have either Mathematica 8 or the free CDF player installed when they visit your website so we need to give them something to look at. So, lets give them a static image of the Manipulate applet. As a bonus, this will act as a place holder for the interactive version for those who do have the requisite software.
Open series.cdf in Mathematica and left click on the bracket surrounding the manipulate (see below). Click on Cell->Convert To->Bitmap. Then click on File->Save Selection As . Make sure you change .pdf to something more sensible such as .png
Don’t save your .cdf file at this point or it won’t be interactive. Re-evaluate the code again to get back your interactive Manipulate.
Here’s one I made earlier – series.png
Step 4 – Hide the source code
In this particular instance, I don’t want the user to see the source code. So, lets sort that out.
- Open series.cdf in Mathematica if you haven’t already and make sure that the Manipulate is evaluated.
- Left click on the inner cell bracket surrounding the Manipulate source code only and click on Cell->Cell Properties and un-tick Open
Step 5 – Hide the cell brackets
Those blue brackets at the far right of the Mathematica notebook are called the Cell brackets and I don’t want to see them on my web site as they make the applet look messy.
- Open series.cdf in Mathematica if you haven’t already
- Open the option inspector: Edit->Preferences->Advanced->Open Option Inspector
- Ensure Show option values is set to “series.cdf” and that they are sorted by category. Click on Apply.
- Click on Cell Options-> Display options and in the right hand pane set ShowCellBracket to False
- Click Apply
Before you save series.cdf ensure that the applet is interactive and not a static bitmap. If it isn’t interactive then click on Evaluation->Evaluate notebook to re-evaluate the (now hidden) source code. Also ensure that there is nothing but the applet anywhere else in the notebook.
Step 6 – Get interactive on your website
Upload series.png and series.cdf to your server. The next thing we need to do is get the static image into our webpage. Here’s what the HTML might look like
<img id="Series_applet" src="series.png" alt="Series demo" />
Obviously, you’ll need to put the full path to series.png on your server in this piece of code. The only thing that is different to the way you might usually use the img tag is that it includes an id; in this case it is Series_applet. We’ll make use of this later.
The magic happens thanks to a small javascript applet called the CDF javascript plugin. Version one is at http://www.wolfram.com/cdf-player/plugin/v1.0/cdfplugin.js and that’s the one I’ll be using here. Here’s the code which needs to be placed before the img tag in your HTML file.
<script src="http://www.wolfram.com/cdf-player/plugin/v1.0/cdfplugin.js"
type="text/javascript"></script><script type="text/javascript">// <![CDATA[
var cdf = new cdf_plugin();
cdf.addCDFObject("Series_applet", "series.cdf", 403,109);
// ]]></script>
The only line you’ll need to change if you use this for anything else is
cdf.addCDFObject("Series_applet", "series.cdf", 403,109);
where Series_applet is the id of the image we wish to replace and series.cdf is the cdf file we want to replace it with. The numbers 403,109 are the dimensions of the applet. These will not be the same as the .png file as the dimensions of the .cdf file are slightly larger. I used trial and error to determine what they should be as I haven’t come up with a better way yet (suggestions welcomed).
So that’s it for now. Hope this mini-tutorial was useful. Let me know if you upload any demonstrations to your own website or if you have any comments, questions or problems.
Update (6th June 2011)
Thanks to ‘Paul’ in the comments section, I have discovered that this mechanism won’t work for .cdf files that Wolfram deem are unsafe. According to Paul the definition of unsafe is as follows:
Dynamic content is considered unsafe if it:
- uses File operations
- uses interprocess communication via MathLink Mathematica Functions
- uses JLink or NETLink
- uses Low-Level Notebook Programming
- uses data as code by Converting between Expressions and Strings
- uses Namespace Management
- uses Options Management
- uses External Programs
I love mathematics and I also love gadgets so you’d think that I’d be overjoyed to learn that there are a couple of new graphical calculators on the block. You’d be wrong!
Late last year, Casio released the Prizm colour graphical calculator. It costs $130 and its spec is pitiful:
- 216*384 pixel display with 65,536 colours
- 16Mb memory
- The CPU is a SuperH 3 running at 58Mhz (according to this site)

More recently, Texas Instruments countered with its color offering, the TI-NSpire CX CAS. This one costs $162 (source) and its specs are also a bit on the weak side but quite a bit higher than the Casio.
- 320*240 pixels with 65,536 colours
- 100Mb memory
- CPU? I have no idea. Can anyone help?
If you are into retro-computing then those specs might appeal to you but they leave me cold. They are slow with limited memory and the ‘high-resolution’ display is no such thing. For $100 dollars more than the NSpire CX CAS I could buy a netbook and fill it with cutting edge mathematical software such as Octave, Scilab, SAGE and so on. I could also use it for web browsing,email and a thousand other things.
I (and many students) also have mobile phones with hardware that leave these calculators in the dust. Combined with software such as Spacetime or online services such as Wolfram Alpha, a mobile phone is infinitely more capable than these top of the line graphical calculators.
They also only ever seem to be used in schools and colleges. I spend a lot of time working with engineers, scientists and mathematicians and I hardly ever see a calculator such as the Casio Prizm or TI NSpire on their desks. They tend to have simple calculators for everyday use and will turn to a computer for anything more complicated such as plotting a graph or solving equations.
One argument I hear for using these calculators is ‘They are limited enough to use in exams.‘ Sounds sensible but then I get to thinking ‘Why are we teaching a generation of students to use crippled technology?‘ Why not go the whole hog and ban ALL technology in exams? Alternatively, supply locked down computers for exams that limit the software used by students. Surely we need experts in useful technology, not crippled technology?
So, I don’t get it. Why do so many people advocate the use of these calculators? They seem pointless! Am I missing something? Comments welcomed.
Update 1: I’ve been slashdotted! Check out the slashdot article for more comments.
Update 2: My favourite web-comic, xkcd, covered this subject a while ago.
Other posts you may find useful / interesting
Welcome to the slightly delayed Carnival of Mathematics #74 – Tungsten Edition. In a departure from COM tradition, this edition is on the same blog as the last edition due to a lack of hosting volunteers. Fortunately, however, the volunteers are starting to turn up and so this is the last month that you’ll have to put up with me for a while. Next month will see the carnival hosted by Daniel over at General Musings and April will be taken care of by AcmeScience (thanks peeps!). The rest of the year is up for grabs so if you’d like to host a future carnival then contact me and we’ll work something out.
One tradition that I’m not about to give up on, however, is the number trivia section. So, let’s see what 74 has for us. In stark contrast to 73, the Chuck Norris of Numbers, 74 doesn’t seem to have much going for it. It’s probably overweight for a start since it is the 3rd hungry number (hungry because it tries to eat as much Pi as possible). Other than that it is odious, semiprime and altogether rather dull!
Enough of the trivia and on with the show.
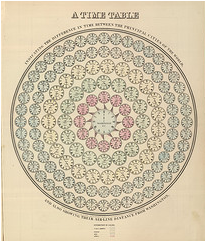
First up we have a post from Datavisualization.ch which shows a set of infographics from around 150 years ago. Much of this work is rather beautiful and demonstrates that the field of infographics is much older than you might think.
 For a rather more modern take on statistics and infographics I highly recommend the UK BBC Four TV documentary, The Joy of Stats. This was a one off show broadcast in late 2010 and hosted by Hans Rosling (Also the star of a brilliant TED talk). Several clips of the show are available over at The Open University and it was recently mentioned by The Royal Statistical Society.
From statistics and onto the theory of numbers with a post by Matt Springer called ‘Sunday Function’. In this post, Matt demonstrates a wonderfully simple proof concerning fractions which have terminating decimal expansions. It turns out that it just happened to be a Sunday morning when I read this delightful little post over coffee and it set me up for the day.
Number theory has been big news in the mathematical world recently thanks to some work by Ken Ono and colleagues who have found a finite, algebraic formula for partition numbers. The original papers can be found at http://www.aimath.org/news/partition/ (thanks to everyone on twitter who sent me that) and there has been discussion all over the web including at Wired.com and The Language of Bad Physics. Emory University (where Ken works) have a press-release but the best resource I’ve found so far is an informal talk by the man himself at YouTube (see below).
One of my biggest personal interests is mathematical software and so my contribution to this month’s carnival is a round-up of mathematical software news for January. January also saw a post from Wolfram Research on how to use some of Mathematica’s new control theory functions to stabilize an inverted pendulum which also serves as a nice introduction to some standard control theory techniques.
Another mathematical software article that was brought to my attention last month was a post from the Mathcad team concerning a very simple looking integral. Computers often do symbolic calculus using different techniques to human beings and this is occasionally reflected in the results. Check out the article for the details.
On a lighter note, we have Music is Math: Ten Songs about Mathematics from Dave Richeson of ‘Division by Zero’ fame. My favourite of the bunch is ‘A finite simple Group of Order 2’ (below) which I’ve some across before. The rest of them, however, are new to me and a lot of fun (and in a couple of cases, quite nice to listen to).
My boss used to be a research mathematician and is something of a pedant (In a good way Chris…in a good way). It seems that this is a trait he has in common with Peter Rowlett, author of Travels in a mathematical world, who has written a piece called Pedantry on Euler and Masts where he investigates the facts behind an old Euler story. There’s also some interesting discussion of the difficulty of presenting maths for the masses.
Whereas I do Random Walking, Sander Huisman does Random Hopping and in the process he comes up with some great looking pictures and interesting mathematics.

John D. Cook compares the iPhone to the method of least squares in When it works, it works really well, Ed4All shows us a mental arithmetic short cut for squares ending in five and Math-Frolic presents A Seemingly Impossible Task, That Isn’t.
Last but by no means least, Guillermo Bautista, organiser of the Math and Multimedia blog carnival, gives us an introduction to similarity while Alasdair’s Musings brings us A cute result relating to sums of cubes.
- Follow the Carnival of Math on Twitter: @Carnivalofmath
- Learn more about Math Carnivals: What is a math carnival?
So here’s a fun (and potentially useful) probability puzzle for you all to ponder. Here in the UK we have an investment option called Premium Bonds. From the premium bonds website:
“Premium Bonds are an investment where, instead of interest payments, investors have the chance to win tax-free prizes. When someone invests in Premium Bonds they are allocated a series of numbers, one for each £1 invested.”
There’s a prize draw every month and a range of prizes from 25 pounds right up to 1 million pounds. You can get your money back at any time with no penalty. So, if you invest 1000 pounds then you get 1000 shots at winning a prize every month for as long as you leave the investment alone. More detailed information such as odds etc is available here.
The way I like to think of premium bonds is that they are a bit like the National Lottery (click here for discussion of odds) except that you get your money back after you’ve played. So I was thinking that, instead of buying premium bonds, an alternative investment strategy would be to put all of your money into a high interest cash account (paying N% per year) and use the resulting interest to buy lottery tickets.
Both strategies offer similar security (you can get your principle investment back at any time) and both of them are a bit of fun since they are based on games of chance. Assuming I am to choose one of these strategies, which one is going to offer me the best rate of return over the long term?
73 is an awesome number. In fact, one could argue that it’s the Chuck Norris of numbers. Here’s why (courtesy of Wikipedia, and Number Gossip):
- The mirror of 73, the 21st prime number, 37, is the 12th prime number. The number 21 has factors 7 and 3.
- In binary, 73 is a palindrome – 1001001
- Of the 7 binary digits representing 73, there are 3 ones.
- Every positive integer is the sum of at most 73 sixth powers.
- In octal, 73 is a repdigit – 111
- Pi Day occurs on the 73rd day of the year (March 14) on non-leap years
- 73 is the largest integer with the property that all permutations of all its substrings are primes
- 73 is the largest two-digit Unholey prime: such primes do not have holes in their digits
- 73 is the smallest number (besides 1) which is one less than twice its reverse
- 73 is the alphanumeric value of the word NUMBER: 14 + 21 + 13 + 2 + 5 + 18 = 73
73 is also the edition number of this, the latest Carnival of Mathematics, to which I bid you welcome. On with the show.
First up we have a mathematical calendar for 2011 courtesy of Ron Doerfler which focuses on Lightning Calculations. I have written about Ron’s calendar before and highly recommend it to all.
The beginning of a new calendar year is an opportunity for all of us to sit back and take stock of everything that took place over the previous 12 months. As a result you’ll find retrospectives of all kinds scattered around the internet and on TV such as The Best Tech Products of 2010, TV’s 11 best Watercooler Moments of the Year and so on. Over at his blog, Wild About Math, Sol Lederman points us to a much more mathematical restrospective of the year 2010 by giving us a heads up about an awesome looking new book.
Next we have the 2011 Mathematics game from Denise of Let’s Play Math; the rules of which can be most simply stated as “Use the digits in the year 2011 to write mathematical expressions for the counting numbers 1 through 100.” Head over there to see more detailed rules, hints, tips, discussion and solutions found so far.
If all of that isn’t quite enough to sate your appetite for all things 2011 then I suggest that you take a look at Patrick Vennebush’s post entitled 2011 – Prime Time which inspired Brent Yorgey to follow up with Prime Time in Haskell. I wonder if 2012 will inspire such mathematical and computational outpourings?
In her post, Two Planes, Tanya Khovanova stumbled across a seemingly innocent looking question in an old edition of Mathematics Teacher which made her take a deep breath and exclaim ‘Ooh, boy!’. Check it out to see what all the fuss is about.
In Redefining Great Britain, GrrlScientist highlights some new research that describes a clever way to redefine and redraw geographical areas using telephone communication networks — it relies on statistics and computing power.
Sander Huisman has a crack at inventing his own fractal based upon the q-gamma function using Mathematica and a heap of computer time. The resulting fractal zoom looks great. He’s also produced a really neat animation of a hinged tesselation.

How do you abbreviate the word ‘Mathematics’? Some say ‘math’ others say ‘maths’ but which came first and which is the most popular? In his post, Math/Maths in Google Books Ngrams, Peter Rowlett uses Google Ngrams to sample millions of books in order to try and determine the answer to these and similar questions.
The trapezoidal rule for numerical integration has been in the news recently and so John Cook of The Endeavour shows us Three surprises with the trapezoid rule.
Imagine that we want to bet on an event with m >= 2 possible outcomes, and that there are n >= 2 bookmakers taking bets on those outcomes. Note that the odds are known at the time the bets are placed, i.e., we have fixed-odds betting instead of pari-mutuel betting. We would like to know how to allocate our (limited) money, i.e., how much to bet on each outcome at each bookmaker. As we cannot foresee the future, we would very much like to lock in risk-less profits. In other words, we would like to find arbitrage opportunities (aka: “arbs”). In his post, Fixed-Odds Betting Arbitrage, Rod Carvalho discusses how, given the (fixed) odds posted by n bookmakers, we can detect the existence of arbitrage opportunities.
PhD student, Gianluigi Filippelli, considers a problem from way back in the 13th century in his post Fibonacci, Bombelli and imaginary numbers. Personally, I’ve always loved some of the historical aspects of mathematics and hope to attend a good course on it some day.
Finally, we have a post from Guillermo Bautista called Chess and the Axiomatic Systems where he provides an intuitive introduction to the notion of axiomatic systems through chess rules.
That’s it for this time but if you still need more mathematical blogging then check out The 12 Math Carnivals of 2010 and don’t forget to submit your articles to the forthcoming Math Teachers at Play carnival.
Follow the Carnival of Math on Twitter: @Carnivalofmath
2010 was a great year for mathematical blogging and this was reflected in the monthly Carnivals of Mathematics. Here they are again in case you missed them.
- January – 61st Carnival at Walkingrandomly
- February – 62nd Carnvial at The Endeavour
- March – 63rd Carnival at Mathrecreation
- April – 64th Carnival at Teaching College Math
- May – 65th Carnival at Maxwell’s Demon
- June – 66th Carnival at Wild About Math
- July – 67th Carnival at Travels in a Mathematical World
- August – 68th Carnival at Plus Magazine
- September – 69th Carnival at JD2718
- October – 70th Carnival at General Musings
- November – 71st Carnival at Theorem of the Day
- December – 72nd Carnival at 360
The cycle will be starting again next week when the 73rd carnival gets published right here at Walking Randomly. What happens after that is up to you because I need volunteers to host future editions. If you are interested then get in touch via the comments section of this post, via twitter or by email.
Links
- What is a maths carnival?
- Math Carnival submission form
- Math Teachers at Play – The sister carnival to CoM
When I was 4 or 5 years old, my father taught me a lot of basic mathematics by exploiting my obsession with my grandmother’s collection of antiquated coins which I played with every chance I got. I loved the weird and wonderful collection of shapes and denominations that made up old English money; thruppenny bits, florins, shillings, ha’pennys, crowns, guineas…..there seemed to be no end to the variety and I loved them all. I was most definitely a noomtist which was the best rendition my young self could give of the word ‘numismatist’.
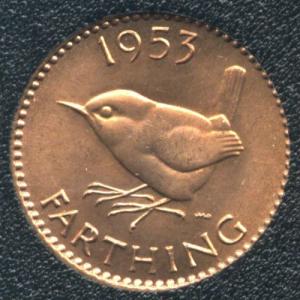
A farthing is an old English coin that was worth a quarter of a penny and Gran had lots of them. Dad would ask me things like “I’ve got a halfpenny and a farthing, if I changed the lot to farthings then how many would I have?” and “How many farthings are there in a sixpence”. Initially I would answer these questions by physically counting the coins. For example, I knew that there were 4 farthings in a penny so I would make 6 stacks of 4 and then count them, one by one, to get the answer: 1,2,3,4,5……21,22,23,24
This became laborious so at some point I’d answer similar questions by ‘counting in 4s’: 4,8,12…. and so on. Eventually, I didn’t need to count – I just knew that 6 stacks of 4 was 24 and so I had been tricked into learning my 4 times table before I had even started school. Dad, for his part, hadn’t delivered a single maths lesson – he just spent a few hours playing shopkeeper with his son.
Later, dad told me that there was such a thing as a third-farthing (1/12 of a penny) but Gran didn’t have any. If she did though, and he had 2 of them along with a farthing and a half-penny coin then how much money would he have? Questions such as this taught me about the arithmetic of fractions with no mention of the words ‘common denominator’ in sight. Good job too because, back then, I doubt I would have been able to pronounce ‘denominator’.
In fact it would be more accurate to say that I ‘discovered how to add fractions’ – my wily old dad didn’t teach me a thing – he just asked me questions about the fascinating little shiny things while we played games together.
Back when I was doing my own research (my field was photonic crystals), I read a lot of research articles in journals such as Physical Review B, Applied Optics and The Journal of the Optical Society of America B. These journals represent the state of the art in their respective fields and if you are not a full time researcher then you will probably find many of their articles difficult to really get into. When I say ‘really get into’ I mean ‘understand well enough that you could reproduce or develop their results if you wanted to’.
These days I am not a full-time researcher (although I do assist many of them on a regular basis) but I still like to read journal articles. The type of journal I read, however, has changed rather a lot since I’m doing it for fun and personal interest rather than for my salary. I sometimes take what I read in these articles and turn them into blog posts and/or Wolfram Demonstrations.
Here’s a list of some of my favourites
- European Journal of Physics: According to their website “The primary mission of European Journal of Physics is to assist in maintaining and improving the standard of taught physics in universities and other institutes of higher education.” There’s lots of cool stuff to be found with past articles including The Kaye effect, Mean Free Path in Soccer and Gases and Cooling and warming laws: an exact analytical solution
- The College Mathematics Journal: According to their website “The College Mathematics Journal is designed to enhance classroom learning and stimulate thinking regarding undergraduate mathematics.”
- The Mathematical Gazette: I could spend all day browsing through the archives of this one – it’s a math nerds dream. For example, when you read an article written in 1894 with the title ‘Some old Text-Books‘ you know that they are going to be really old! It’s also fun to compare the ‘problems and solutions’ from 1900 to those from 2000. From the website “The Mathematical Gazette is the original journal of the Mathematical Association and it is now over a century old”
- Mathematics Magazine: I’ve had one or two ideas for Wolfram Demonstrations from this magazine. From the website “Mathematics Magazine presents articles and notes on undergraduate mathematical topics”
What journals do you recommend for fun and/or teaching purposes in areas such as physics, mathematics and statistics?
Update The following are recommendations from readers in the comments section. Thanks to everyone who responded. Feel free to let me know if your favourite isn’t on this list.