
Archive for December, 2007
While catching up on some news items that I missed over the festive period I noticed that version 3.0 of Octave was released on December 21st 2007. For those of you who have never heard of it before, Octave is an open-source project that attempts to emulate much of the core functionality of Matlab – an extremely popular commercial mathematics application centered around linear algebra and numerical analysis. Octave has been around for some time now – version 1.0 was released back in 1994 so it is certainly not just a flash in the pan.
Octave aims to be source compatible with Matlab wherever possible which means that in many cases you can take code written for Matlab, feed it to octave and it will just work. As you might expect this compatibility is far from perfect but it is good enough for many purposes. Some core Matlab functions have not yet been implemented in Octave and there are also some syntactic differences between the programming languages of the two packages but in many situations the compatibility is quite good and I used it myself very successfully back in the days before I had access to Matlab. A more detailed discussion of Octave-Matlab compatibility can be found on the Octave website.
You can read about some of the changes made to Octave for the version 3.0 release over at Octave’s news page. One of the most interesting updates seems to be that Octave now has increased compatibilty with Matlab’s Handle graphics system. It’s been a while since I used Octave myself so I will be having a play with it on my daily commute over the next few weeks to see what I can see.
If you hit this page from google while looking for open-source Matlab alternatives you might also want to check out Scilab, Freemat and Sage.
While tidying up the attic I came across my copy of the 2nd edition of The Penguin Dictionary of Curious and Interesting Numbers by David Wells – it’s at the 4th edition now so an update of my library is well overdue. I love this book and have wasted many an hour flicking through it’s pages – which is why my attic is still such a mess. Since it is almost 2008 I wondered if there were any interesting facts about the number 2008 and moved to the relevant section in the book – nothing! The last year before 2008 that was listed was 1980:
“1980-0891=1089 which is one of only 5 patterns in which subtracting a 4 digit number from its reversal leaves the digits rearranged.”
The next entry was 2025 which implies that we have a lot of rather dull years ahead – (only numerically speaking I hope). Of course, as everyone knows, there is no such thing as an uninteresting number (check out the wikipedia page for The Interesting Number Paradox to find a “proof”) and so I embarked on a search to find out why the number 2008 was interesting (to me at least).
I failed! Here is the best I could do (thanks to this site):
2008 is a Kaprekar constant in base 3
So there you have it – 2008 is a boring number and to make things worse my attic is still untidy. Someone out there please try and prove me wrong – find something interesting about this number and let me know in the comments. If it passes my own personal test of ‘interestingness’ (loosely defined as anything that makes me say “thats cool”) then I will update this page with the results
Update
I have had a few great responses to this post most of which can be found in the comments section. My favourites are:
2008 is a Happy Number
There are exactly 1000 numbers less than 2008 that share no factors in common with 2008. That is, Euler’s totient function phi(2008) = 1000 (check here.) Would it be correct to say that 2008 is the beginning of the next Euler totient millenium then?
2008 is the prime number 251 multiplied by the sum its own digits.
Update 2 (Jan 8th 2008)
I have just discovered another blog post that has some fun facts about 2008 over at 360 – my favorite of which is
2008 can be written as the sum of of 16 consecutive positive integers: 118+119+120+…+132+133
The latest carnival of mathematics, hosted by Wild About Math, has been posted and contains 16 different articles – well worth a look.
A few years ago Rainer Keuchel ported version 3.7 of the popular open source plotting tool, Gnuplot, to devices running WinCE. I discovered it back when I was running Windows Mobile 2003SE on my Dell Axim X50v and it worked very nicely. Recently I thought I would test it on my new Windows Mobile 6 device but before I got around to doing this I discovered that André Stemper had recently ported version 4.2 to Windows Mobile.
Gnuplot has come a long way since version 3.7 and so I was quite excited about this new port. Although there is no .cab file, the installation procedure is straightforward, simply download the zip file and extract it to the desired location on your device. To run it you just find the .exe file in the file explorer and double click on it. If you want Gnuplot to appear in start->Programs then you will need to manually create a shortcut which I have been told is not difficult but I have so far not done it myself. I like the fact that you can install directly on your device without the need for Activesync and a PC but a .cab file that takes care of the shortcut for you would have been even better.
Gnuplot is a console-based application but you will not need to install a 3rd party console application such as pocket console in order to use it since this port includes it’s own console built in. When you run the program you will see a screen similar to the one below.
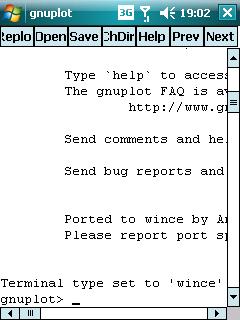
Anyone who has used gnuplot before will instantly feel at home as it works just like the desktop version. For example typing
plot tan(x)
results in the following graph – pretty much identical to the desktop version.
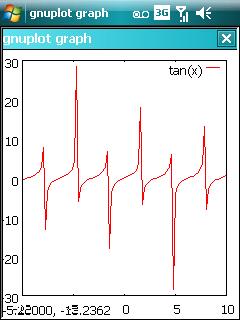
The above plot looks odd, not because there is anything wrong with this port, but because gnuplot does not plot the tan function very well by default – those pesky singularities you see. Manually setting the x and y axes results in something much better.
set xrange [-5:5]
set yrange [-10:10]
plot tan(x)
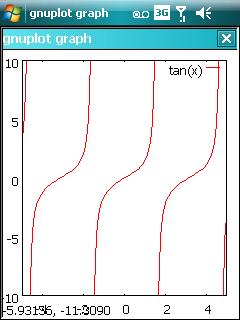
Obviously things are a little more cramped on a 240×320 QVGA device as compared to your desktop but it is perfectly use-able. This port also supports full VGA devices (in fact it was developed on one) so if you are lucky enough to have one of these you will get even more mileage from the application. One way of getting a little more screen real estate is to set gnuplot to ‘fit window’ mode which gets rid of the second window title bar – you can also set it to full screen mode while removes all surrounding title bars.
Long time users of Gnuplot will know that you can write scripts in order to generate more complicated graphs and this functionality is also supported in the pocket version. In many cases you can just transfer a script written on your desktop machine to your PDA, open it in pocket Gnuplot and it will just work. As you might expect there are one or two things are not supported in the pocket version though. For example, in the full version of Gnuplot you can set the terminal to output .png files using the command
set terminal png
but this is not supported in the pocket version since the number of available terminals is limited. One minor gripe that I have is that I cannot seem to find a way to output a graph to an image file that is natively supported by Windows Mobile so I cannot produce a plot in gnuplot and then open it in the standard image viewer. Of course one way around this is to use some sort of screenshot-taking program as I did for all of the images in this post.
If you would like to write Gnuplot scripts directly on your hand held rather than transferring them from a desktop machine then I highly recommend using the freeware pocket notepad application. The built in text editor of Total Commander will also do the job nicely but please do not use a word processing package such as Pocket Word as the resulting file will contain all manner of formatting rubbish that will confuse Gnuplot and result in a stream of errors.
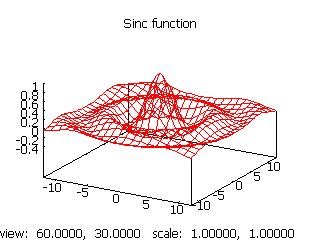
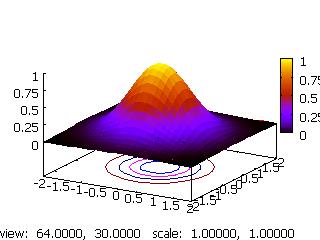
On the desktop version of Gnuplot you can click on a 3D plot with your mouse and rotate it in real time which can be very useful for looking at various features of your function or data. This is supported in this port but it does not work as well since it takes a while to replot the graph at each angle. This means that you can still view the plot from any angle you choose using the stylus but you cannot move it around in real time which is a shame as it would have looked very cool as well as being rather useful. I guess this is due to the reduced processing power available on pocket devices.
Another minor problem with this port is that the help files are not included which can be annoying when you are on the train and cannot remember the exact syntax for some rarely used feature. These really are just minor issues though – almost everything from the Desktop version is here – take a look at these full screen 3d plots taken straight from my Tytn II in landscape mode for example.
I could go on to discuss many more features such as the ability to evaluate and plot special functions (eg. Bessel functions, the Gamma function or the lambertw function), contour plots, histograms, scatter plots etc etc but then this would end up being a review of Gnuplot itself rather than a review of this port. Gnuplot is a very powerful and feature-rich piece of software and this pocket version brings almost all of that functionality to Windows Mobile powered PDAs and I highly recommend it.
If you have never used Gnuplot before and would like an idea of what it can do then I suggest taking a look at the Gnuplot homepage or the very informative Gnuplot-tips page.
The Mathworks have a fantastic blog written by Loren Shure called The Art of Matlab which should be on the reading list of every Matlab user. Yesterday she invited a guest blogger, Jiro Doke, to write about how to use Matlab to generate publication-quality graphs. In the article Jiro starts with a very basic Matlab figure like this one:

and teaches you the required commands to turn it into this

The full article can be found by clicking here.
Recently, someone over at comp.soft-sys.math.mathematica had a simple problem – he had a 1d array of y-values which he wanted to plot. Easy enough – if his array is in a variable called dataset all he would need to do is
Listplot[dataset]
which would create a plot of x-y values with the x values being 1,2,3….. and so on. The problem the poster had was that he wanted the x-axis to start at 100 rather than the default which is 1.
Several people, including me, tried to be helpful and posted solutions that were along the lines of ‘create an explicit set of x-values, starting at 100, do some trickery to turn the two arrays into a set of x,y pairs and plot the result’. For example you could do this with
(*Assume that the array is in a variable called dataset*)
x = Range[100, 100 + Length[dataset] - 1];
ListPlot[Transpose@{x, dataset}]
This works fine but we should have read the new version 6 documentation because (as pointed out by someone else on the forum) there is now a much easier way of doing this using the DataRange option.
ListPlot[dataset, DataRange -> {100, 100 + Length[dataset]}]
I was recently playing around with version 14 of Mathcad and discovered that it had a problem with calculating the following indefinite integral symbolically.

The result Mathcad gives is
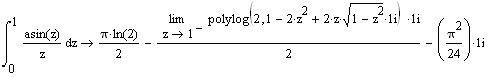
Which looks pretty scary. If I bypass the symbolic engine and calculate it numerically then I get a result of about 1.089 which is equal to the first term of Mathcad’s symbolic solution:

So if MathCAD has got the symbolic solution correct then the scary looking term containing the limit should cancel out the imaginary term. I have never come across the polylog function before so I tried to look it up in Mathcad’s help system but there was no reference to it there – a bit of an oversight in my opinion considering it seems to be a built in function. (A google search later and polylog turns out to be short for polylogarithm – the entry on Wolfram’s mathworld looks like a good place to start learning about it – yet another thing on my list of things to learn.)
Clearly Mathcad’s symbolic engine wasn’t capable of evaluating this limit so I had to try something else. The thought of trying to evaluate it by hand briefly crossed my mind but I didn’t fancy my chances much since I didn’t have a clue about the polylog function. My next thought was to fire up Matlab (2007a) and try its symbolic toolbox. First of all – Would it succeed to evaluate the integral where Mathcad had failed?
>> syms x
>> int(asin(x)/x,x,0,1)
ans =1/8*i*pi^2+1/4*pi*log(2)+1/2*pi*log(1-i)
>> simplify(ans)
ans =1/2*pi*log(2)
No problems there then but could it help with the polylog limit that would determine if I had found a bug in Mathcad? At first, the answer seemed to be ‘no’ since I couldn’t find a reference to polylog in Matlab either but, after a bit more googling, I discovered that polylog(2,x) is sometimes called the dilogarithm function and this is implemented in matlab as dilog(x) according to the help browser. Unfortunately it is not implemented for symbolic variables so I was stumped there as well.
Since I am a fortunate soul and have access to pretty much every computer algebra system that is worth having I then turned to Mathematica. Just like Matlab, Mathematica had no problem with solving the integral that stumped Mathcad:
Integrate[ArcSin[x].{x,0,1}]
gave
1/2*Pi*Log[2]
It also fully implemented the polylog function so I could try the limit:
-I/2*Limit[PolyLog[2, 1 – 2 x^2 + 2 x Sqrt[1 – x^2]], x -> 1]
gave
-I Pi^2/24
Which confirmed that Mathcad had got the correct result but just couldn’t simplify it fully like its two rivals could.
Finally, I would like to set a challenge to anyone who stumbles across this little part of the web – could you evaluate this integral by hand? I can’t but would love to know how it might be done. If anyone finds a solution please let me know.
On the morning of my 8th birthday my life was changed forever when I received a shiny new 48k ZX Spectrum + – the year was 1985 and this event signified the beginning of my love affair with computers. Back then the school playground was divided into two main camps – those of us who had Sinclair Spectrums and those who had a Commodore 64 and the rivalry was fierce – I even remember once being involved in a fist fight that started with a Speccy vs Commodore argument (it was probably the most pathetic punch up ever – 8 year old proto-geeks are not well known for their fighting prowess).
Of course there was the occasional oddball who had something weird like an Amstrad CPC464 (or in the case of my mate Tom – an Oric of all things) but in the main it was C64 v Spectrum and, I guess, this was my first ever technical holy war (and the only one that ended up with a physical fight).
22 years later and, like all first loves, the Speccy still holds a place in my heart but my opinions are not as polarised as they once were. These days I occasionally admit that the C64 was a good machine and, when no one is looking, I might fire up an emulator to have a game on something like the Great Giana Sisters or Wizball (the spectrum version was a bit poor you see).
One thing that I simply cannot deny is that the music on the Spectrum was just plain awful whereas that of the Commodore was quite simply stunning for its time. The sound chip on the C64 was called the Sound Interface Device (SID) and was probably the most advanced sound chip on any 8-bit home computer. Game designers used the chip to great effect in titles such as International Karate, Spellbound and R-Type – this stuff was as close as you could get to ‘proper music’ on an 8-bit computer.
Some C64 compositions are so good in fact that an an orchestra in Holland decided that they would perform full orchestral versions of them! If you head over to their myspace page you can listen to some of the results and, in my opinion at least, they are quite beautiful. What’s more – they have produced a CD with their music on it – just look at this CD Box:

Now it’s not exacty cheap – once postage and packing was taken into account it cost almost 30 pounds but I just had to order it. Expect a review here soon.
All I wanted to do was change hello.cpp to hello.txt on my PDA. You would think that changing the file extension of a file on a windows mobile 6 device would be easy wouldn’t you? Well you would be wrong. The built in file explorer is useless – there is no way to even get it to see the file extension let alone change it.
Thankfully there is a solution – someone in the forums over at mobilitysite suggested that I take a look at the freeware (or possibly shareware – I am not sure at the moment) application – Total Commander. This looks very similar to the built in file explorer but has a lot more functionality – there is even a built in text editor! Needless to say – changing the file extension is now a straightforward thing to do. I recommend this package to everyone without hesitation.
