
Mathematica colorbarplot v0.5
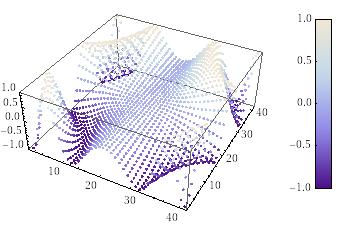
Will Robertson and I have released a new version of our colorbarplot package for Mathematica 6 and above. Colorbarplot has only one aim and that is to allow Mathematica users to add a MATLAB-like colorbar to their graphs. Something like this for example:
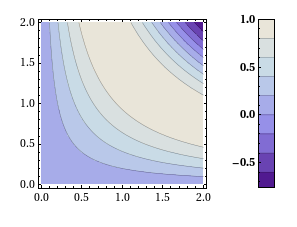
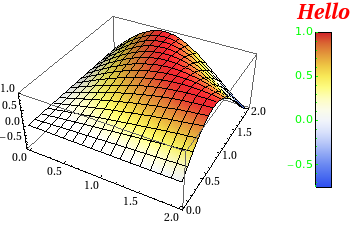
Version 0.5 is a very small upgrade from 0.4 in that it allows you to change the font style of the colorbar ticks as well as it’s label – as requested by Murat Havzalı. Here are a couple of examples of the new functionality:
ColorbarPlot[Sin[#1 #2] &, {0, 2}, {0, 2},
 PlotType -> "Contour",
 CTicksStyle -> Bold]
ColorbarPlot[Sin[#1 #2] &, {0, 2}, {0, 2},
 PlotType -> "3D",
 CLabel -> "Hello",
 ColorFunction -> "TemperatureMap",
 CLabelStyle -> Directive[Red, Italic, Bold, FontSize -> 20],
 CTicksStyle -> Directive[Green, FontFamily -> "Helvetica"]
 ]
Colorbarplot comes with an extensive examples file and you can download version 0.5 either from me or from Will’s github repository. We hope you find it useful and comments are welcomed.
- UPDATE 12th Novermber 2010. Update to version 0.6
Hi Mike,
Can I use this with ListPlot, ListLogPlot,… etcetera ? i.e. non-functional plotting.
Best Regards,
Sander
Hi Sander
Yes you can. The full list of functions is described in the version 0.4 post linked to at the bottom of this post and there are some examples within the package itself.
It something is missing, or if you have any comments then let us know.
Cheers,
Mike
Mike,
Very useful package. I couldn’t believe Mathematica doesn’t come with this built in.
Questions or suggestions for future versions:
1. Log-Log plots or log scale for Colorbar.
2. Allow user to put colorbar scale in ScientificForm.
3. Currently when putting colorbar plots into GraphicsGrid, there is a lot of overlap and it doesn’t always look good.
4. Allow a colorbar for multiple graphs. i.e. have a grid of 4 plots all with one colorbar on the right. Seems like that would be hard to do.
Thanks for making this package.
Nick
Hi Nick
Glad you like it and thanks for the suggestions – I’ve added them to the wants list :)
I can’t promise anything immediately as I am crazy busy at the moment but as soon as I get something new coded up I’ll be in touch by email.
Of course Will (The package co-author) might beat me to it depending on the state of his schedule.
Cheers,
Mike
The package can be mode even more flexible if the minimum and maximum of a listplot are determined someway like this:
min=Min[Select[Flatten@plotinput,NumericQ]];
max=Max[Select[Flatten@plotinput,NumericQ]];
This allows plotting of datasets with missing (undefined) values.
Thanks for your great work!
Thomas