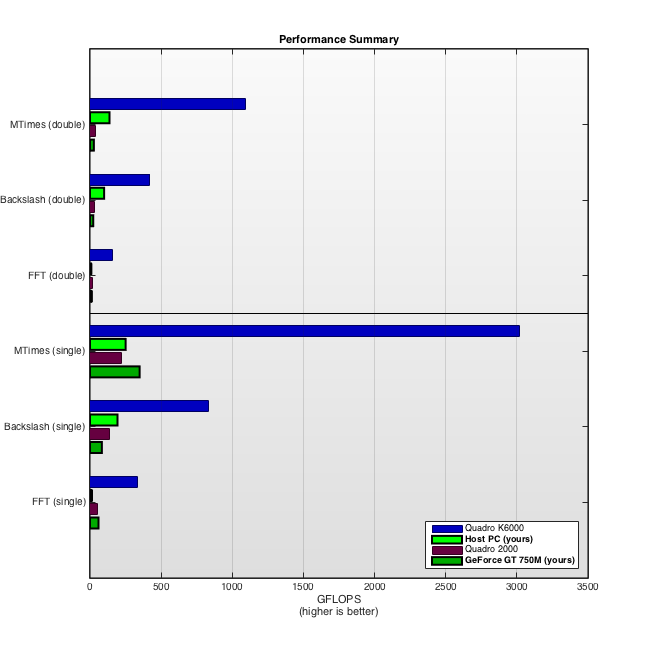
GPU Comparison Report: Host PCSummary of resultsThe table and chart below show the peak performance of various GPUs using the same MATLAB version. Your results (if any) are highlighted in bold in the table and on the chart. All other results are from pre-stored data. The peak performance shown is usually achieved when dealing with extremely large arrays. Typical performance in day-to-day use will usually be much lower. Results captured using the CPUs on the host PC (i.e. without using a GPU) are included for comparison. Since MATLAB works mostly in double precision the devices are ranked according to how well they perform double-precision calculations. Single precision results are included for completeness. For all results, higher is better.
Generated by gpuBench v1.7: 2015-03-12 15:58:41 | |||||||||||||||||||||||||||||||||||||||||||