
A MATLAB Christmas card
The guys at Blinkdagger put together a great MATLAB Christmas card for you all and sent it in to me as part of the Walking Randomly Christmas challenge. I would have posted it earlier but I have been away from the Internet over Christmas (sorry Rob). Thanks guys!
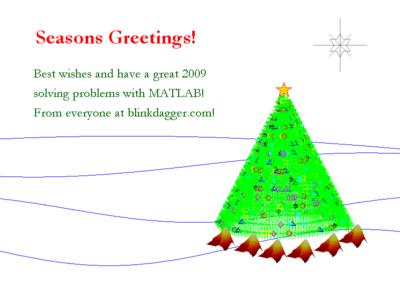
A brief explanation of the maths involved (from Rob of Blinkdagger)
– the snowdrifts are sine waves of different amplitudes and offsets
– the tree is a 3D spiral of green asterisks
– the ornaments are a random selection of the same points as the tree,
with different colors and marker types
– the presents under the tree are the trademark “membrane” surface that is the MATLAB logo.
– the star atop the tree, as well as the star in the sky are just single points graphed, but using the default marker types creatively
– the text is, well it’s just text
% Xmas card from blinkdagger.com for the challenge
%% setup the fig
h1 = figure(‘Position’,[50 50 800 600],’Color’,’w’);
%% Put background snowdrifts and star
axes(‘Position’,[0 0.5 1 .05]);
ezplot(‘sin(.1*x+1.8)’); axis off; title(”);
axes(‘Position’,[0 0.4 1 .1]);
ezplot(‘sin(.3*x)’); axis off; title(”);
axes(‘Position’,[0 0.25 1 .1]);
ezplot(‘sin(.4*x-1.5)’); axis off; title(”);
axes(‘Position’,[0 0.1 1 .15]);
ezplot(‘cos(.4*x-2)’); axis off; title(”);
axes(‘Position’,[0.75 0.75 0.2 0.2]);
plot(1,1,’x’,’markersize’,48,’markeredgecolor’,[.5 .5 .5]);
axis off; title(”); hold on;
plot(1,1,’h’,’markersize’,36,’markeredgecolor’,[.5 .5 .5]);
plot(1,1,’+’,’markersize’,80,’markeredgecolor’,[.5 .5 .5]);
hold off;
%% Put tree on and decorate it
axes(‘Position’,[0.55 0.2 0.4 0.6]);
z = 0:.05:100;
x = cos(z); x = (101-z).*x;
y = sin(z); y = (101-z).*y;
plot3(x,y,z,’g*’,’markersize’,18); axis off; view(0,10);
hold all;
% star on top
plot3(0,0,107,’p’,’markersize’,24,’markerfacecolor’,[1 .8431 0],…
‘markeredgecolor’,’r’);
% plot ornaments
k = rand(size(x));
k1 = k>.97;
k2 = k>.94 & k<.97;
k3 = k>.91 & k<.94;
k4 = k>.88 & k<.91;
k5 = k>.85 & k<.88;
k6 = k>.82 & k<.85;
plot3(x(k1),y(k1),z(k1),’ro’,’markersize’,8,’linewidth’,2); axis off; view(0,10);
plot3(x(k2),y(k2),z(k2),’ys’,’markersize’,8,’linewidth’,2); axis off; view(0,10);
plot3(x(k3),y(k3),z(k3),’md’,’markersize’,8,’linewidth’,2); axis off; view(0,10);
plot3(x(k4),y(k4),z(k4),’b^’,’markersize’,8,’linewidth’,2); axis off; view(0,10);
plot3(x(k5),y(k5),z(k5),’kh’,’markersize’,8,’linewidth’,2); axis off; view(0,10);
plot3(x(k6),y(k6),z(k6),’c*’,’markersize’,8,’linewidth’,2); axis off; view(0,10);
hold off;
%% Put presents under the tree
axes(‘Position’,[0.5 0.12 0.1 0.15]);
colormap(hot*.7); surf(membrane,membrane); shading flat; axis off; view(300,20);
axes(‘Position’,[0.57 0.1 0.1 0.15]);
surf(membrane); shading flat; axis off; view(300,20);
axes(‘Position’,[0.63 0.08 0.1 0.15]);
surf(membrane); shading flat; axis off; view(300,20);
axes(‘Position’,[0.7 0.08 0.1 0.15]);
surf(membrane); shading flat; axis off; view(300,20);
axes(‘Position’,[0.77 0.1 0.1 0.15]);
surf(membrane); shading flat; axis off; view(300,20);
axes(‘Position’,[0.83 0.13 0.1 0.15]);
surf(membrane); shading flat; axis off; view(300,20);
%% Overlay snowflakes
%% Text greeting
axes(‘Position’,[.05 .6 .5 .5]); axis off;
text(.08,.55,’Seasons Greetings!’,’fontsize’,30,’color’,’r’,…
‘fontname’,’Garamond’,’fontweight’,’bold’);
text(.07,.31,’Best wishes and have a great 2009′,’fontsize’,20,…
‘color’,[0 .4 0],’fontname’,’Garamond’);
text(.07,.18,’solving problems with MATLAB!’,’fontsize’,20,…
‘color’,[0 .4 0],’fontname’,’Garamond’);
text(.07,.05,’From everyone at blinkdagger.com!’,’fontsize’,20,…
‘color’,[0 .4 0],’fontname’,’Garamond’);