
New version (0.4) of Mathematica ColorbarPlot package released.
Some time ago now I worked with Will Robertson to produce a package that allowed Mathematica users to add MATLAB like colorbars to their graphs. The package was called ColorbarPlot and version 0.3 was released on Wolfram’s Library Archive last October. It was very well received and we were both pleased to find that people were actually finding it useful. The feature requests started rolling in and Will and I started to hack in extra bits of functionality as they were requested. Eventually, we had enough new features hacked in to demand a rewrite which Will duly did and the resulting version 0.4 of the ColorbarPlot package was sent out to a few users a little while ago.
We refrained from actually announcing it though since we wanted this new version to replace the old one in the Wolfram Library. Will sent them an email ages ago but has heard nothing and so we decided to just publish it ourselves. So, without further ado, here is a link to a zip file containing the ColorbarPlot package itself along with an examples notebook.
Think of this as a ‘snapshot’ of the live package – it will never change and is hosted on my server. If you have googled your way here and are wondering if there is a newer version then you should take a look at Will’s GitHub repository where you will always be able to find the latest version of ColorbarPlot along with some other packages that he has authored. Will’s own announcement of this upgrade can be found on his website.
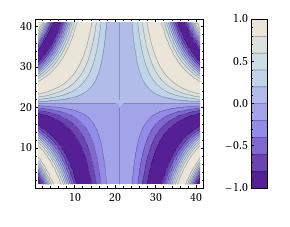
So, what’s new in this version? The most useful change is that you can now add colorbars to List based plots – useful for experimental data. The following piece of Mathematica code creates a List of data and uses ColorbarPlot to plot it.
data2d = Table[Sin[x y^2], {x, -2, 2, 0.1}, {y, -2, 2, 0.1}];
ColorbarPlot[data2d, PlotType -> “Contour”]
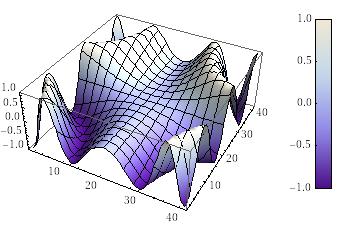
Of course you are not limited to just 2D list based plots
ColorbarPlot[data2d, PlotType -> “3D”]
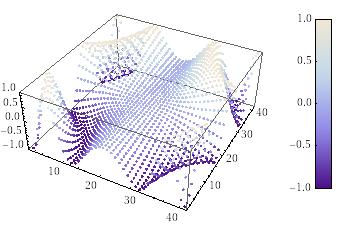
ColorbarPlot[data2d, PlotType -> “Point3D”]
The full list of Plot types you can use with ColorbarPlot is
- (List)ContourPlot
- (List)DensityPlot
- (List)Plot3D
- ListPointPlot3D
Other new features include the ability to manually choose the min/max scale of the colorbar, the ability to fine tune the padding and height of the colorbar along with various clean ups and bug fixes. All new (and old) features are documented and demonstrated in the accompanying examples notebook. Thanks to Will for his hard work on this release (he did most of it – my contributions are rather small this time).
Feedback and suggestions are, as always, very welcome. If you publish any results using this package then please let me know – it would be great to see.
This is awesome! Thanks for finally solving my ListDensityPlot woes.
How do I install the package? I tried putting the ColorBarPlot directory under $AddOnsDirectory but I get an error message when I try to load the package.
Thanks for this this package, it’s handy. But how can we change the fonts and/or font size of the colourbar ticks?
Looks great…
How to shrink the axes of the plot? I guess PlotRange should do this. But only for f[x,y] and it is not working for x,y. Why? Or does it work in a different way?
Hi Johann
I’m not sure what you mean? Can you post some example code please and tell me what you expected to see compared to what you do see.
Also, are you using the latest version – 0.5?
http://www.walkingrandomly.com/?p=1782
Cheers,
Mike
Hi, thanks for making this package. I am having trouble installing it though. I’m using Mathematica 6.0, and have tried installing both colorbarplot 0.4 and 0.5, but with no luck. I thought I might be installing it wrong, but I used the exact same procedure with the Discrete Wavelets package and that worked fine. Any idea what might be up?
Cheers,
Iain
Hi Mike,
I like to use PlotRange like this but this do not work.
PlotRange -> {{-.1, .1}, {0, .002}, {0, Max[data]}}
Only PlotRange -> {0, Max[data]} works fine. It also do not work in the latest version 0.5.
Cheers Johann
Iain,
OK, what I suggest you do is to move the ColorbarPlot.m file into the
following location in the Mathematica installation
C:\Program Files\Wolfram Research\Mathematica\6.0\AddOns\Packages
The exact location of this Packages folder may vary on your machine.
Now open Mathematica and evaluate
$Path
You should see the above folder somewhere in the results. Now all you
need to do in order to load the package is to evaluate
<< ColorbarPlot` I have just gone through this procedure on a clean test machine and it works for me. Could you let me know how you get on please?
Hi Mike,
That worked. Thanks a lot for responding so quickly.
Cheers,
Iain
Hi Mike,
I have some problems with colorbar- 0.5. I have mathematica 6.0- windows vista. I put the programm on C:\Program Files\Wolfram Research\Mathematica\6.0\AddOns\Packages, but it doesn’t work. Could you helpe with any suggestion??
Best Regards
Merry
THANKS! after struggling for several hours with ShowLegend etc. I found your package, which is awesome!!You should send it to Wolfram, it should be included by default in installation.
Hi,
I want to use to like ListDensityPlot. My data is in the form {{x1,y1,z1},{x2,y2,z2},….} but it takes the same the scale of the x and y values for the color, instead the z values? What could be the problem?
Thanks for writing a nice package. Is it possible to use it with MatrixPlot?