
A plot gallery for Mathematica 9
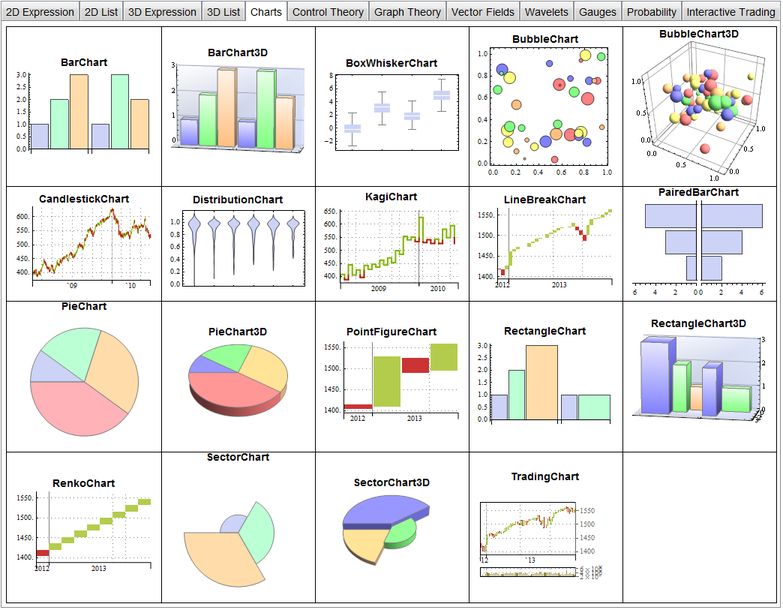
I’m working on a presentation involving Mathematica 9 at the moment and found myself wanting a gallery of all built-in plots using default settings. Since I couldn’t find such a gallery, I made one myself. The notebook is available here and includes 99 built-in plots, charts and gauges generated using default settings. If you hover your mouse over one the plots in the Mathematica notebook, it will display a ToolTip showing usage notes for the function that generated it.
The gallery only includes functions that are fully integrated with Mathematica so doesn’t include things from add-on packages such as StatisticalPlots.
A screenshot of the gallery is below. I haven’t made an in-browser interactive version due to size.
I really loved this. Thanks!