
Colorbarplot version 0.6
If you love your code…set it free! That’s what Will Robertson did when he released the first version of colorbarplot for Mathematica. I liked what he did but it didn’t do quite enough for my needs so I added some stuff to it and a new version was born.
Our package starting getting users and some of those users asked for things so Will and I added yet more stuff and colorbarplot version 0.5 was born.
Finally, one of those users, Thomas Zell of the University of Cologne, has added more functionality of his own resulting in version 0.6 of colorbarplot. So, what’s new?
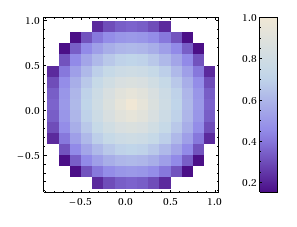
Well, if you have data in the form of a two-dimensional array, in which not every entry has valid numerical data, the following will now work without error:
set1 = Table[
   If[Sqrt[x^2 + y^2] < 1, Sqrt[1 - Sqrt[x^2 + y^2]]], {x, -1, 1,      0.125}, {y, -1, 1, 0.125}];
ColorbarPlot[set1, InterpolationOrder -> 0,
 DataRange -> {{-1, 1}, {-1, 1}}]
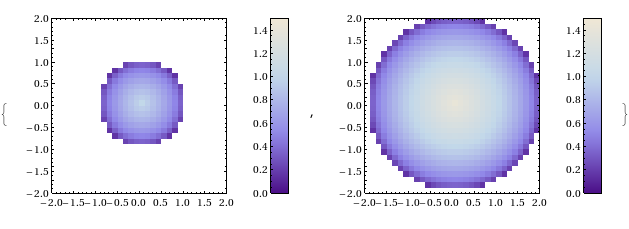
Next up, if you want to compare two data sets, the plots have to have the same scale even if the data sets have different sizes. This can now be achieved with the PlotRange option:
set2 = Table[
  If[Sqrt[x^2 + y^2] < 2, Sqrt[2 - Sqrt[x^2 + y^2]]], {x, -2, 2,    0.125}, {y, -2, 2, 0.125}];

{ColorbarPlot[set1, InterpolationOrder -> 0,
 DataRange -> {{-1, 1}, {-1, 1}},
 PlotRange -> {{-2, 2}, {-2, 2}, {0, 1.5}}],
ColorbarPlot[set2, InterpolationOrder -> 0,
 DataRange -> {{-2, 2}, {-2, 2}},
 PlotRange -> {{-2, 2}, {-2, 2}, {0, 1.5}}]}
This is great stuff, helps make colorbarplot more useful and turns the package into a truly international collaboration ;)
- ColorbarPlot’s github page The latest version will always be available here
- ColorbarPlot’s page in the Wolfram Library This is often out of date.
- ColorbarPlot 0.6 from the WalkingRandomly server
- ColorbatPlot 0.5 My write up of a previous version
- ColorbarPlot 0.4 My write up of a previous version
- ColorbarPlot 0.3 My write up of a previous version
Have you published anything that uses colorbarplot?
If you have published anything that uses our little package then please do let us know. We know we have users so it would be great to see how you are using it. The more feedback we get, the more likely we are to want to develop it further.
Hello,
Now, I am using Mathemtica version 8.0.
I want to install the package (ColorbarPlot)
I put the package in the folder with the path: C/Programmes/Wolfram Research/Mathematica/8.0/AddOns/Packages. However, when I called this package to use, it said that: “can not open ColorbaPlot” (shown below).
<>
I don’t know why. Could you help me please?
Thank you.
Nguyen
Hi
Did you unzip the package so that the folder ColorbarPlot goes into C/Programmes/Wolfram Research/Mathematica/8.0/AddOns/Packages
Also, how did you load the package? Try copying and pasting the following: some people miss out the `
I’m using Linux right now rather than windows but that shouldn’t be an issue. I’ll try it out on a Windows machine tomorrow.
Hi,
the 0.6 version of the package appears to be heavily corrupted. The input cell defining the functions are strangely divided. E.g., the cell defining the function Internal ColorbarPlot reads:
InternalColorbarPlot[parseplot_,plotinput_,
opts:OptionsPattern[]] := Module[
The definition appears to span over many cells. A formating bug I guess.
This formatting was (very!) intentional at the time, and it has always been like this, but perhaps it’s time to reconsider. The idea is that Mathematica has no problem reading in the package, and comments/structured headings can written mid-cell; consider the list of sections in the drop-down box in the toolbar—it’s much more detailed that you could otherwise do if each cell was entirely self-contained.
But you’re right that it’s generally not how Mathematica expects packages to be written (since it also screws up syntax highlighting). It’s a shame that Mathematica’s literate programming isn’t quite as granular as I’ve come to expect from noweb or even LaTeX’s docstrip format.
hi:
is there a way to force the package to pass certain options to the underlying plot?
For example I am doing something like this:
ColorbarPlot[dataList[[1]][[All, {1, 3, 2}]], PlotType -> “Contour”,
ContourLabels -> All, InterpolationOrder -> 3,
Contours -> 10, ContourStyle -> Thin]
but the Contours parameter gets only controls the number of contours in the colorbar and NOT the main plot. Ideally I suppose one would want a version of ‘ColorbarOpts’ that would always pass options to the underlying plot. Does something like that exist?
thank you.
Hi,
First, I would like to say that you guys did an excellent job! This is exactly what I need be able to replace gnuplot for Mathematica to do my contour and density plots!
But, I just could not install it correctly: I am using a Mac, and what I did (based on the first comment in this thread) was to copy the entire folder ColorBarPlot to Mathematic/AddOns/Packages (where there are lots of other folders like ANOVA, FiniteFields, …), Then, when I use the suggested comand to start it, it does not work:
In[3]:= Needs[“ColorbarPlot`”]
During evaluation of In[3]:= Get::noopen: Cannot open ColorbarPlot`. >>
During evaluation of In[3]:= Needs::nocont: Context ColorbarPlot` was not created when Needs was evaluated. >>
Out[3]= $Failed
Could you please help me?
Alexandre
Hi,
I want to use to like ListDensityPlot. My data is in the form {{x1,y1,z1},{x2,y2,z2},….} but it takes the same the scale of the x and y values for the color, instead the z values? What could be the problem?
Hi,
I am trying to make something like Matlab’s “scatterplot” in Mathematica including a colorbar for lists of data, and was thrilled to find your package!
Unfortunately, it appears that when using your ColorbarPlot with PlotType -> “Point3D”, the ColorFunction->”func” will only accept the standard color gradients for func. Commands for reversing them or defining my own color function, which both work for ListContourPlot for instance, are not accepted by ColorbarPlot.
Is there any way to make this work for ColorbarPlot, and if yes, how? (I use Mat’ca 7.0 and package version 0.6)
Many thanks in advance,
David
@Alexandre
I am also on a Mac. I downloaded v0.6 to my desktop and unzipped it there. A folder appear with ColorbarPlot.m in it. I moved this file to /Libary/Mathematica/Kernel. I then went back to my notebook (already open) and added Needs[“ColorbarPlot`”] at the top. Then I took the plot I was working on, that needed a colorbar, and modified it as shown in the ColorbarPlot documentation
(old) DensityPlot[Sin[x*y], {x, 0, 2}, {y, 0, 2}]
(new plot with colorbar) ColorbarPlot[Sin[#1 #2] &, {0, 2}, {0, 2}, PlotType -> “Density”, CTicksStyle -> Bold]
So everything worked for me. Hope this helps.
@Mike Croucher
Hi, I am also using Linux and I put the unzipped file into /home/me/.Mathematica/ but when calling the package I got the same problem as Alexandre. Did I put it in the wrong directory? What should I do? Thanks in advance!
@Mike Croucher
Nevermind, I figured it out now. Thank you very much!
@Jason
Thank you so much!!! I can’t even remember how I solved my problem (without using Colorbarplot, which I was not able to install at that time). I was browsing my RSS feed reader when I saw a post here about Colorbarplot: after reading it I saw your (very simple and effective) answer. Sorry by taking so long to thank you!